
Demographic Factors and Behavioral Biases in the Bangladesh Capital Market , Impact of Demographic Factors on Different Behavioral Biases of Individual Investors of Bangladesh Capital Market.
Keywords: Demographic Factors, Behavioral Bias, Illusion of Control Bias, Cognitive Bias, Herd Instinct Bias, Loss Aversion Bias, Self-Attribution Bias.
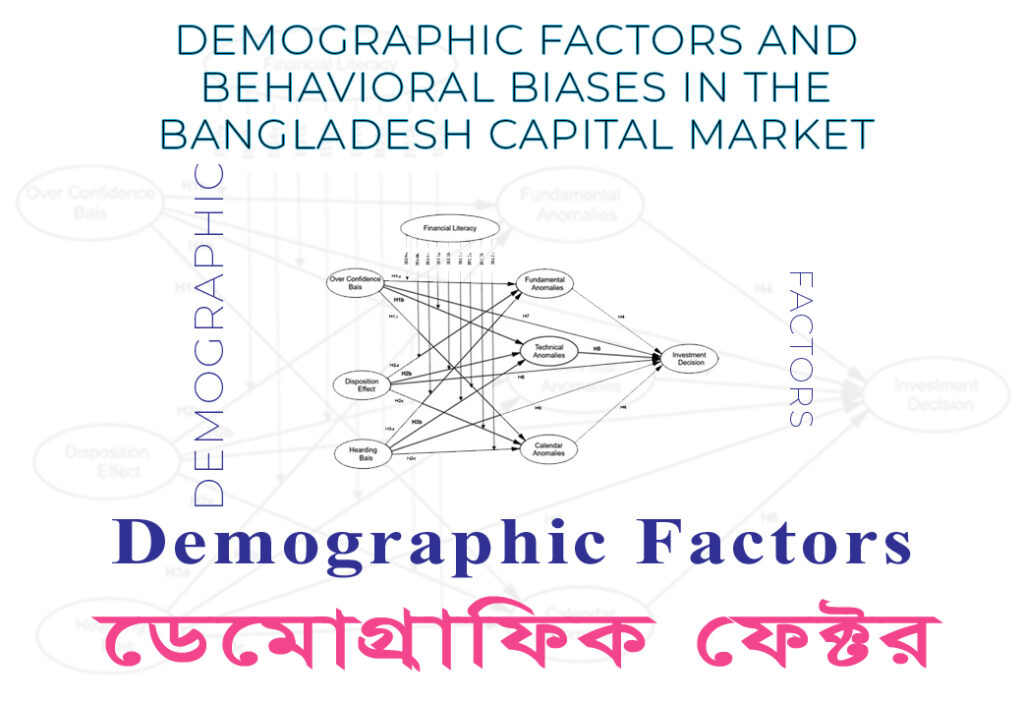
Demographic Factors and Behavioral Biases in the Bangladesh Capital Market
1. INTRODUCTION
Economic growth and sustainable development are the rudimentary requisites that every nation wants to fulfill. To stimulate the growth of the economy and to ensure its sustainability, long-term funding is required. Specially, for an emerging economy like Bangladesh such funding plays a pivotal role in the economic growth and development. Often the duration of this long-term funding is much longer than the duration for which most investors or savers are willing to commit their funds. These sorts of psychology of the investors occlude the passage to economic growth. In this regard, capital market provides the room for mobilization and utilization of the long-term funds used to ensure sustainability and growth of the economy (Isenmila et al.,2012).
Capital Market in Bangladesh is regarded as inefficient, unstable and highly volatile. This means that the market does not respond readily with the advent of any price sensitive information but gradually absorbs publicly available information providing a few market participants the systematic way to exploit the trading opportunities and earn abnormal profits. Such trait entices other retail investors to go with the flow and earn a fortune before the market corrects itself. Since the investment decisions are not mostly driven by fundamental analysis, the market tends to be more unstable and volatile.
According to the traditional theories of finance, investors make their investment decisions rationally when investing in the capital market. In a practical scenario during making investment decisions, it has been observed that investors do not always make a rational decision, rather it is their psychological biases impacting their choice of decisions (Kahneman & Riepe, 1998). This irrationality can successfully be linked with the investors of many countries like Bangladesh where investors have already experienced a massive market collapse several times due to the anomalies by behavioral biases (Khan et al., 2015). For an emerging economy like Bangladesh, where the capital market is extremely concentrated, behavioral finance places an urge to study more about the behavioral anomalies being perceived in the financial market of Bangladesh (Islam et al., 2018). Moreover, all the notable stock market crashes of the Bangladeshi capital market strengthen the conception of the inefficient market, signifying the failure of traditional theories of finance.
Despite the acceptance of the existence for behavioral aspect of investors worldwide, in a developing economy such as Bangladesh, behavioral aspects are not considered and practiced properly, which ultimately affects the overall performance and prediction of the capital market. One major aspect of human emotions and cognitive limitations being un approached for major investment decisions ultimately leads to the problem of unexpected returns and inherent risks of abnormal volatility.
This paper therefore contributes to the investigation of behavioral biases that are prevalent in the Bangladeshi stock market as an explanation for interrupting the rationality of individual investors and mitigating the stock market anomalies of securities. In the process, the problem with certain financial choices made by investors can be better explained and advanced to propose a behavioral finance approach as a mainstream alternative theory to traditional finance in an emerging market like Bangladesh.
Behavioral finance usually tries to distinguish between the predictions of the economic theories about the actions people would take in the heat of the moment and the actual actions taken by the people. Such deviation basically arises from the behavioral biases which affect people’s decision making process. For example, due to the inability to analyze the available information an individual investor may get affected by cognitive bias while making investment decisions. Such bias occurs when an investor perceives the information around him/her and hold fast to it or unable to process the information bringing about the best interest for him/her.
Some investors tend to avoid losses rather risking to gain more. Often this tendency persuades the investors pull back quite early from an investing position when an equivalent gain on assets is ensured. Although, there may be an opportunity for potential gain investors get caught with this loss aversion bias. Another behavioral bias which is widely prevalent among the retail investors is herd instinct bias. Such bias compels the individual investor to follow everybody else’s investment decisions without proper analysis. People have such tendency in order to protect themselves from the loss and to reward with a maximum profit (Raddatz and Schmukler, 2011).
There are also another group of people who take credit for all the past successes but blame others or luck or any other external factors for the failures. Such psychological stance is called self-attribution bias. This bias may make an investor overconfident and overestimate his/her capabilities in decision making.
Another type of behavioral bias that leads people to overconfidence and overestimating their capabilities is illusion of control bias. Such bias makes people think that they have a control over the outcome of the investment decisions they have taken and they pretty confident about their success. Thus, people affected by control bias may misinterpret the market.
In order to identify the source of the behavioral biases of the investors, some demographic factors are being anticipated to be the key drivers. Such as: age, gender, investing experience and education. These factors may contribute to some of the behavioral biases like illusion of control bias, cognitive bias, self-attribution bias, herd instinct bias and loss aversion bias.
For instance, age may be one of the most influential demographic factors affecting investor behavior and biases. Younger investors may exhibit a higher risk tolerance and propensity for short-term trading. They are also more likely to succumb to biases such as overconfidence and the disposition effect. However, older investors typically make more conservative and risk-averse investment choices.
The degree of education may have a significant impact on the behavioral biases of investors. Well-educated investors may possess better financial knowledge and analytical skills, leading to more informed investment decisions. They are less susceptible to biases like anchoring or herd mentality.
Investors’ experience in the capital market plays a significant role in shaping their behavior and biases. Since novice investors often follow the herd without doing in-depth research, they may be more vulnerable to biases like herding. Conversely, seasoned investors might be less susceptible to transient market swings and possess superior risk management abilities.
Another demographic factor that may have an impact on investment behavior is gender. Male investors may be more confident and engage in greater trading activity than their female counterparts. Contrarily, female investors may be less prone to biases like overtrading or pursuing past performance and more risk averse. In the context of Bangladesh there are very limited research activities regarding the impact of demographic factors of the individual investors on the behavioral biases.
Investigating the ways in which diverse demographic factors may affect distinct behavioral biases among individual investors is crucial when examining Bangladesh’s capital market. This project paper basically tries to ensure whether the demographic factors have any impact on the behavioral biases of the investors. To conduct the study, we have taken the valued opinions of 223 investors who are directly engaged in the investment activities in the capital market of Bangladesh. Considering the demographic factors as independent variables and the behavioral biases as dependent variables we have conducted multiple linear regression analysis through R-Studio software in five different models. Each model was formulated by taking one behavioral bias at a time. Upon analyzing the results, the study has shown that some of the behavioral biases (illusion of control bias, loss aversion bias, self-attribution bias) are significantly susceptible to demographic factors while other biases are found to remain unaffected by the demographic factors.
Demographic Factors and Behavioral Biases in the Bangladesh Capital Market

2. REVIEW OF LITERATURE
Behavioral biases have a significant impact on investors, leading them to invest in less risky avenues. Sharma (2020) established the link between investment decisions and demographic factors such as gender, age, education level, and income. However, there are conflicting findings regarding the association between gender and behavioral factors. Specifically, the studies of J. Elizabeth (2020) have found that gender and income influence overconfidence bias, age is influenced by the disposition effect, and occupation is influenced by herding bias. Lin (2011) found that male investors are more prone to overconfidence and herding bias, while female investors tend to have a higher herding tendency. However, there is no major evidence regarding the influence of occupation and level of annual income on investment decisions.
Sharma (2020) studied the investment patterns of individual investors in India and the behavioral biases present in investment decision-making. The paper also examined the effect of demographic profiles on investment decision-making. The study found that investors are influenced by behavioral bias to a large extent, which is why they avoid taking risks and invest in less risky avenues in India. The study also found that there is a significant association between investment decision and demographic profile of the respondent’s i.e., gender, age, education qualification, and income class.
Barber and Odean (2001) discovered that gender plays a significant role in making an investment decision and they also found that women were less confident than men. Chitra and Jayashree (2014) found that demographic variables named gender, age, experience, and education have an association with the behavioral issues in investment choices. Sadiq and Ishaq (2014) in their survey explored that investors’ academic background, investment knowledge, income level, age, and experience in investment have a vital influence on the investors’ behavior. Lewellen, Lease, and Schlarbaum (1977) concluded that investors’ gender, age, education, and income have a significant influence on their investing attitudes and preferences.
Das and Jain (2014) survey discovered that the demographical factors named gender, age, occupation, and education had an association with the purposes of investment. Khanam (2017) performed a survey on 300 investors of DSE to detect the demographic influence on the investment decision making during the period of dividend declaration and the major finding of the study is that there was an affiliation between demographic variables (age, occupation, experience, educational level and income level of general investors) and their investment decision. Kengatharan (2019) study revealed that the investors’ socio-economic features i.e., age, marital status, gender, monthly income, and educational qualifications had a statistically substantial effect on the investment decisions making of retail investors. Obamuyi (2013) found that the age, gender, marital status, and educational qualifications of investors significantly influenced the investors’ investment decisions in Nigeria. Kaleem, Wajid and Hussain (2009) found that income, age, education, and language have a noteworthy role in determining the investor’s investment style in Pakistan. Shaikh and Kalkundrikar (2011) identified that demographic factors such as like level of income, educational qualifications, level of market knowledge, gender, marital status, age and the number of dependents influence investors’ investment decisions. Alquraan, Alqisie, and Al Shorafa (2016) examined the influence of demographic issues on the investment decisions in the Saudi Stock Market and showed that apart from education, other variables such as gender, education, age, income, and experience didn’t create any influence on the investment choices. Fatima and Shafi (2016) studied that gender and marital status has no impact on the investment behavior while on the other hand age and occupation has a significant relation with the investment behavior of individual investors of Kashmir. Aminda Methsila Perera (2016) explored the relationship between investor behavior and demographic factors such as gender, marital status, age, education, occupation, type of investing, and experience. The finding confirmed that there seems to be a certain degree of correlation between investor demographics and investor behavior.
Demographic Factors and Behavioral Biases in the Bangladesh Capital Market
3. OBJECTIVES OF THE STUDY
The objective of this study is to find out whether any kind of relationship exists between the demographic factors (age, gender, experience and education) and the behavioral biases (illusion of control bias, cognitive bias, herd instinct bias, loss aversion bias, self-attribution bias) of the individual investors in Bangladesh capital market.
Demographic Factors and Behavioral Biases in the Bangladesh Capital Market
4. METHODOLOGY OF THE STUDY
Research Design:
The analysis of this study is based entirely upon quantitative data. The study looked into various demographic factors (age, gender, education, experience) and biases (illusion of control bias, herd instinct bias, cognitive bias, loss aversion bias and self-attribution bias) which are measured using different sets of questionnaires. Our source of information is primary source, through questionnaires.
Thirteen closed-ended questionnaires were prepared and randomly distributed to different investors around the country. The data were mainly collected from the active investors of Chattogram, Rajshahi, Sylhet, Bogura and Dhaka city. A total of 233 responses were collected, among which 223 responses were filled in completely by the respondents.
The questionnaire included mainly investors’ demographic information and questions related to certain behavioral biases. All items of the questionnaire were measured by a 5-point Likert scale with anchors ranging from 1 = strongly disagree to 5 = strongly agree. To perform the analysis, Likert-type items were grouped into a “survey scale”, and a mean score was calculated from that grouped item. The data were analyzed using descriptive statistics and multiple linear regression analysis.
Variable
In this study Illusion of Control Bias, Herd Instinct Bias, Cognitive Bias, Loss Aversion Bias and Self-Attribution Bias are taken as dependent variables while Gender, Age, Education and Experience are taken as independent variables.
Unit of analysis
The study concentrates on the relationship between demographic factors and investor’s behavioral biases while making share trading decisions. So, the unit of analysis for this study is Individual Respondents.
Sample Design
This study focuses on the analysis of total active investors in Bangladesh Capital market. Since its time efficient, a convenient simple random sampling approach is used to pick the samples. In addition, data is gathered from primary sources and questionnaires related to the study’s major variables are used. A total of 223 respondents were used as a sample for the study.
Impact of Demographic Factors on Different Behavioral Biases of Individual Investors of Bangladesh Capital Market.
5. LIMITATIONS OF THE STUDY
Getting a very limited time schedule i.e. approximately one month after attending the final exam is a great challenge for preparing this project paper. Besides, academic responsibilities, regular job activities and family obligations made it difficult to complete this project paper most of the time.
Another major limitation is that the collection of investors’ response about the questionnaire from different part of the country took most of the time. We believe that, providing more time will produce in-depth research activities in this topic.
Demographic Factors on Different Behavioral Biases of Individual Investors of Bangladesh Capital Market.
6. DATA PROCESSING
Responses were manually screened for missing data or incomplete responses and the relativity was examined using the R-Studio software.
7. DATA ANALYSIS TOOLS
For the purpose of data analysis, the tools being used are categorized below:
- Descriptive analysis: This gives the description of the data collected through various variables of the study using tools like mean, median, mode and standard deviation.
- R-Studio: This provides results that help determine, whether there exists a relationship between demographic factors and the behavioral biases.
Impact of Demographic Factors on Different Behavioral Biases of Individual Investors of Bangladesh Capital Market.
8. RESULTS AND DISCUSSION
Demographic Details
Table-1: Demographic Factors
| Variables | Class | Number of Respondents | Percentage (%) |
| Age (years) | 18-24 | 1 | 0.45% |
| 25-31 | 22 | 9.87% | |
| 32-38 | 69 | 30.94% | |
| 39-45 | 64 | 28.70% | |
| 46-52 | 32 | 14.35% | |
| 53-69 | 21 | 9.42% | |
| 60-66 | 9 | 4.04% | |
| 67-73 | 5 | 2.24% | |
| Total | 223 | 100.00% | |
| Gender | Male | 184 | 82.51% |
| Female | 39 | 17.49% | |
| Total | 223 | 100.00% | |
| Education | Hons. | 36 | 16.14% |
| HSC | 6 | 2.69% | |
| Masters | 170 | 76.23% | |
| MBBS | 7 | 3.14% | |
| Others | 4 | 1.79% | |
| Total | 223 | 100.00% | |
| Experience (years) | 0-5 | 63 | 28.25% |
| 06-11 | 62 | 27.80% | |
| 12-17 | 68 | 30.49% | |
| 18-23 | 17 | 7.62% | |
| 24-29 | 5 | 2.24% | |
| 30-35 | 4 | 1.79% | |
| 36-41 | 3 | 1.35% | |
| 42-47 | 1 | 0.45% | |
| Total | 223 | 100.00% | |
| Occupation | Business | 15 | 6.73% |
| Doctor | 10 | 4.48% | |
| Govt. | 127 | 56.95% | |
| Others | 19 | 8.52% | |
| Private | 37 | 16.59% | |
| Student | 4 | 1.79% | |
| Teacher | 11 | 4.93% | |
| Total | 223 | 100.00% | |
From the above table, it is found that, the demographic factor Age represents highest 30.94% in the range of 32-38 years (69 respondents), Gender represents highest 82.51% in Male (184 respondents), Education represents highest 76.23% in Masters Degree (170 respondents), Experience represents highest 30.49% in the range of 12-17 years (68 respondents) and Occupation represents highest 56.95% in Govt. service holder (127 respondents) among the 223 respondents.
Table-2: Summary of Behavioral Responses
| No. | Statements | Variables | Percentage Frequency of the Respondents | ||||
| SD | D | N | A | SA | |||
| 01. | Only financial literacy and investment knowledge make me profitable. | Illusion of Control Bias | 8.97% | 33.18% | 9.42% | 30.49% | 17.94% |
| 02. | Investment in fundamental companies following the financial performance increases the profitability. | Illusion of Control Bias | 1.35% | 14.35% | 21.52% | 49.78% | 13.00% |
| 03. | I, Myself take my Investment Decision without influence of Rumor in social media or unauthorized source. | Overconfidence Bias | 9.87% | 19.73% | 16.14% | 34.08% | 20.18% |
| 04. | I only consider only the public information in case of making Investment Decision. | Overconfidence Bias | 5.38% | 30.94% | 24.22% | 28.25% | 11.21% |
| 05. | I am holding to my investments because selling them would incur loss. | Cognitive Bias | 7.62% | 9.42% | 11.21% | 54.26% | 17.49% |
| 06. | I am sure that I can make correct investment decision. | Overconfidence Bias | 4.04% | 18.83% | 39.91% | 28.70% | 8.52% |
| 07. | Thinking hard and for a long time about the investment decision sometimes gives me satisfaction. | Herd Instinct Bias | 0.90% | 15.70% | 12.11% | 55.16% | 16.14% |
| 08. | I was informed about all the fundamentals of the company that I am confident in making my investment. | Illusion of Control Bias | 2.69% | 21.52% | 17.94% | 45.29% | 12.56% |
| 09. | I intend to sell my investments immediately it goes back to the acquisition price. | Loss Aversion Bias | 14.80% | 42.60% | 12.11% | 26.91% | 3.59% |
| 10. | The previous profits generated from similar investments by the company made it very attractive to me to invest in it. | Hindsight Bias | 4.48% | 17.94% | 27.35% | 41.70% | 8.52% |
| 11. | My past history influences the present investment decision. | Representativeness Bias | 0.90% | 5.38% | 10.76% | 63.68% | 19.28% |
| 12. | The investment was more of a bad/ good luck than it was my own judgment. | Self-Attribution Bias | 21.52% | 28.70% | 25.11% | 20.18% | 4.48% |
| 13. | I am holding my investment because I know the prices will revert soon. | Regret Aversion Bias | 2.24% | 15.25% | 22.42% | 46.64% | 13.45% |
Figure-1: Percentage Scenario of Different Behavioral Biases


The above Likert Model representing the response percentages of the respective questions in the questionnaire where, R1 = Strongly Disagree, R2 = Disagree, R3 = Neutral, R4 = Agree and R5 = Strongly Agree.
Table-3: Descriptive statistics
| Variable | Observation | Mean | Median | Mode | Std. Dev. (%) | Min | Max |
| Representativeness bias | 223 | 4.165 | 4.000 | 4.000 | 0.7559 | 1 | 5 |
| Cognitive bias | 223 | 3.869 | 4.000 | 4.000 | 1.1570 | 1 | 5 |
| Overconfidence bias | 223 | 3.744 | 4.000 | 3.333 | 0.8987 | 1.333 | 5 |
| Herd instinct bias | 223 | 3.941 | 4.000 | 4.000 | 0.9960 | 1 | 5 |
| Illusion of control bias | 223 | 3.717 | 3.666 | 4.333 | 0.8019 | 1.666 | 5 |
| Loss aversion bias | 223 | 2.860 | 2.000 | 2.000 | 1.3798 | 1 | 5 |
| Hindsight bias | 223 | 3.865 | 4.000 | 4.000 | 1.2117 | 1 | 5 |
| Self-attribution bias | 223 | 3.076 | 2.000 | 5.000 | 1.5934 | 1 | 5 |
| Regret aversion bias | 223 | 3.986 | 4.000 | 4.000 | 1.0842 | 1 | 5 |
From the above table, it is found that all the biases except loss aversion bias and self-attribution bias have the mean and median are more than 3.00 which indicates that the biasness exists among the respondents under consideration.
Multiple Linear Regression Model:
To analyze the relationship between the behavioral biases and the demographic factors of the individual investors in the capital market of Bangladesh, I used the following multiple linear regression models:
Y = 𝛽0 + 𝛽1𝑋1𝑖 + 𝛽2𝑋2𝑖 + 𝛽3𝑋3𝑖 + 𝛽4𝑋4𝑖 + 𝛽5𝑋5𝑖 + 𝛽6𝑋6𝑖 + 𝛽7𝑋7𝑖 + εi (i = 1, 2, 3, …., 223)
Where the response variable Y represents the Illusion of Control Bias, Cognitive Bias, Herd Instinct Bias, Loss Aversion Bias and Self-Attribution Bias respectively. On the other hand, 𝑋1𝑖, 𝑋2𝑖, 𝑋3𝑖, 𝑋4𝑖, 𝑋5𝑖, 𝑋6𝑖 and 𝑋7𝑖 represents Age, Sex Male, Education HSC, Education Masters, Education MBBS, Education Others and Experience respectively. Besides, 𝛽0 represents the intercept and 𝛽1, 𝛽2, 𝛽3, 𝛽4, 𝛽5, 𝛽6 and 𝛽7 represents the coefficients of determination.
INTERPRETATION:
Model-1:
Illusion of Control Bias = 𝛽0 + 𝛽1Age+ 𝛽2SexMale + 𝛽3EducationHSC + 𝛽4 EducationMasters + 𝛽5 EducationMBBS + 𝛽6 EducationOthers + 𝛽7 Experience + εi (i = 1, 2, 3, …., 223)
The response variable in the above model is Illusion of Control Bias, whereas, the Age, Sex Male, Education HSC, Education Masters, Education MBBS, Education Others and Experiences are the independent variables.
Besides, to check whether the above model is adequate for estimating the impact of demographic factors on illusion of control bias, I conduct the F-test with the following null and alternative hypothesis;
H0 : 𝛽0 = 𝛽1 = 𝛽2 = ……… = 𝛽7 = 0, against
H1 : 𝛽i ≠ 0 (i = 0, 1, ……., 7), at least one occurs.
I found that, the p-value is 0.003116 which is less than 0.05. So, I reject the null hypothesis at 5% level of significance. Hence, the model is adequate for estimating the impact of demographic factors on illusion of control bias.
Regression Analysis
In Order to identify the impact of independent variables (Age, Sex Male, Education HSC, Education Masters, Education MBBS, Education Others and Experiences) on dependent variable (Illusion of Control Bias), I tried to execute the Multiple Regression Model using R-Studio software and found the following results which are given in the table format. The output of the R-Studio is given in the appendix-A.
Table-4: Different values of Multiple Linear Regression Analysis using Model-1
| Coefficients | Estimate | Std. Error | Pr (>|t|) |
| (Intercept) | 3.951034 | 0.311040 | < 2e-16*** |
| Age | 0.004138 | 0.007128 | 0.56213 |
| SexMale | -0.413824 | 0.140221 | 0.00352** |
| EducationHSC | 0.543066 | 0.348302 | 0.12042 |
| EducationMasters | -0.250774 | 0.142682 | 0.08024 |
| EducationMBBS | -0.076260 | 0.325180 | 0.81481 |
| EducationOthers | -0.204398 | 0.411324 | 0.61975 |
| Experience | 0.010486 | 0.009215 | 0.25639 |
Signif. codes: 0 ‘***’ 0.001 ‘**’ 0.01 ‘*’ 0.05 ‘.’ 0.1 ‘ ’ 1
| Particulars | Value | Particulars | Value | |
| F-Statistic | 3.189 | Multiple R-squared | 0.09407 | |
| p-value | 0.003116 | Adjusted R-squared | 0.06457 |
Impact of Demographic Factors on Different Behavioral Biases of Individual Investors of Bangladesh Capital Market.
Discussion:
Demographic Factors and Behavioral, From the R-output, it is found that, Multiple R-squared is 0.09407 that means in the aspect of illusion of control bias about 9.41% total variation can be explained by the set of independent variables. The estimated regression equation reveals that the p-value of the Sex Male is 0.00352 which is less than 0.05 that means this demographic factor is significant for affecting the illusion of control bias.
Model-2:
Cognitive Bias = 𝛽0 + 𝛽1Age+ 𝛽2SexMale + 𝛽3EducationHSC + 𝛽4 EducationMasters + 𝛽5 EducationMBBS + 𝛽6 EducationOthers + 𝛽7 Experience + εi (i = 1, 2, 3, …., 223)
The response variable in the above model is Cognitive Bias, whereas, the Age, Sex Male, Education HSC, Education Masters, Education MBBS, Education Others and Experiences are the independent variables.
Besides, to check whether the above model is adequate for estimating the impact of demographic factors on cognitive bias, conducted the F-test with the following null and alternative hypothesis;
H0 : 𝛽0 = 𝛽1 = 𝛽2 = ……… = 𝛽7 = 0, against
H1 : 𝛽i ≠ 0 (i = 0, 1, ……., 7), at least one occurs.
I found that, the p-value is 0.5673 which is greater than 0.05. So, I do not reject the null hypothesis at 5% level of significance. Hence, the model is not adequate for estimating the impact of demographic factors on cognitive bias.
Regression Analysis
Demographic Factors and Behavioral, In Order to identify the impact of independent variables (Age, Sex Male, Education HSC, Education Masters, Education MBBS, Education Others and Experiences) on dependent variable (Cognitive Bias), I tried to execute the Multiple Regression Model using R-Studio software and found the following results which are given in the table format. The output of the R-Studio is given in the appendix-B.
Table-5: Different values of Multiple Linear Regression Analysis using Model-2
Demographic Factors and Behavioral,
| Coefficients | Estimate | Std. Error | Pr (>|t|) |
| (Intercept) | 3.363317 | 0.465325 | 8.44e-12*** |
| Age | 0.008197 | 0.010664 | 0.443 |
| SexMale | -0.124616 | 0.209776 | 0.553 |
| EducationHSC | 0.652791 | 0.521070 | 0.212 |
| EducationMasters | 0.311540 | 0.213457 | 0.146 |
| EducationMBBS | -0.268800 | 0.486480 | 0.581 |
| EducationOthers | 0.092632 | 0.615354 | 0.880 |
| Experience | 0.001359 | 0.013785 | 0.922 |
Signif. codes: 0 ‘***’ 0.001 ‘**’ 0.01 ‘*’ 0.05 ‘.’ 0.1 ‘ ’ 1
| Particulars | Value | Particulars | Value | |
| F-Statistic | 0.8252 | Multiple R-squared | 0.02616 | |
| p-value | 0.5673 | Adjusted R-squared | -0.005541 |
Discussion:
Demographic Factors and Behavioral, From the R-output, it is found that, Multiple R-squared is 0.02616 that means in the aspect of cognitive bias only 2.61% total variation can be explained by the set of independent variables. The estimated regression equation reveals that the p-value of all the independent variable is greater than 0.05 that means the demographic factors are not significant for affecting the cognitive bias.
Model-3:
Demographic Factors and Behavioral
Herd Instinct Bias = 𝛽0 + 𝛽1Age+ 𝛽2SexMale + 𝛽3EducationHSC + 𝛽4 EducationMasters + 𝛽5 EducationMBBS + 𝛽6 EducationOthers + 𝛽7 Experience + εi (i = 1, 2, 3, …., 223)
The response variable in the above model is Herd Instinct Bias, whereas, the Age, Sex Male, Education HSC, Education Masters, Education MBBS, Education Others and Experiences are the independent variables.
Besides, to check whether the above model is adequate for estimating the impact of demographic factors on herd instinct bias, conducted the F-test with the following null and alternative hypothesis;
H0 : 𝛽0 = 𝛽1 = 𝛽2 = ……… = 𝛽7 = 0, against
H1 : 𝛽i ≠ 0 (i = 0, 1, ……., 7), at least one occurs.
I found that, the p-value is 0.9059 which is greater than 0.05. So, I do not reject the null hypothesis at 5% level of significance. Hence, the model is not adequate for estimating the impact of demographic factors on herd instinct bias.
Demographic Factors and Behavioral
Regression Analysis
In Order to identify the impact of independent variables (Age, Sex Male, Education HSC, Education Masters, Education MBBS, Education Others and Experiences) on dependent variable (Herd Instinct Bias), I tried to execute the Multiple Regression Model using R-Studio software and found the following results which are given in the table format. The output of the R-Studio is given in the appendix-C.
Table-6: Different values of Multiple Linear Regression Analysis using Model-3
| Coefficients | Estimate | Std. Error | Pr (>|t|) |
| (Intercept) | 3.7564516 | 0.4033286 | <2e-16*** |
| Age | 0.0004439 | 0.0092429 | 0.962 |
| SexMale | -0.0138240 | 0.1818268 | 0.939 |
| EducationHSC | 0.2196427 | 0.4516465 | 0.627 |
| EducationMasters | 0.1915707 | 0.1850172 | 0.302 |
| EducationMBBS | -0.0701786 | 0.4216651 | 0.868 |
| EducationOthers | 0.7183194 | 0.5333684 | 0.179 |
| Experience | 0.0013843 | 0.0119486 | 0.908 |
Signif. codes: 0 ‘***’ 0.001 ‘**’ 0.01 ‘*’ 0.05 ‘.’ 0.1 ‘ ’ 1
| Particulars | Value | Particulars | Value | |
| F-Statistic | 0.3928 | Multiple R-squared | 0.01263 | |
| p-value | 0.9059 | Adjusted R-squared | -0.01952 |
Discussion:
Demographic Factors and Behavioral
From the R-output, it is found that, Multiple R-squared is 0.01263 that means in the aspect of herd instinct bias only 1.26% total variation can be explained by the set of independent variables. The estimated regression equation reveals that the p-value of all the independent variable is greater than 0.05 that means the demographic factors are not significant for affecting the herd instinct bias.
Model-4:
Loss Aversion Bias = 𝛽0 + 𝛽1Age+ 𝛽2SexMale + 𝛽3EducationHSC + 𝛽4 EducationMasters + 𝛽5 EducationMBBS + 𝛽6 EducationOthers + 𝛽7 Experience + εi (i = 1, 2, 3, …., 223)
The response variable in the above model is Loss Aversion Bias, whereas, the Age, Sex Male, Education HSC, Education Masters, Education MBBS, Education Others and Experiences are the independent variables.
Besides, to check whether the above model is adequate for estimating the impact of demographic factors on loss aversion bias, conducted the F-test with the following null and alternative hypothesis;
H0 : 𝛽0 = 𝛽1 = 𝛽2 = ……… = 𝛽7 = 0, against
H1 : 𝛽i ≠ 0 (i = 0, 1, ……., 7), at least one occurs.
I found that, the p-value is 0.0009051 which is less than 0.05. So, I reject the null hypothesis at 5% level of significance. Hence, the model is adequate for estimating the impact of demographic factors on loss aversion bias.
Regression Analysis
Demographic Factors and Behavioral
In Order to identify the impact of independent variables (Age, Sex Male, Education HSC, Education Masters, Education MBBS, Education Others and Experiences) on dependent variable (Loss Aversion Bias), I tried to execute the Multiple Regression Model using R-Studio software and found the following results which are given in the table format. The output of the R-Studio is given in the appendix-D.
Table-7: Different values of Multiple Linear Regression Analysis using Model-4
| Coefficients | Estimate | Std. Error | Pr (>|t|) |
| (Intercept) | 4.237362 | 0.531433 | 9.02e-14*** |
| Age | 0.003847 | 0.012179 | 0.7524 |
| SexMale | -0.584007 | 0.239578 | 0.0156* |
| EducationHSC | -1.111087 | 0.595097 | 0.0633 |
| EducationMasters | -0.969238 | 0.243782 | 9.58e-05*** |
| EducationMBBS | -0.614667 | 0.555594 | 0.2698 |
| EducationOthers | -1.314109 | 0.702776 | 0.0629 |
| Experience | -0.022221 | 0.015744 | 0.1596 |
Signif. codes: 0 ‘***’ 0.001 ‘**’ 0.01 ‘*’ 0.05 ‘.’ 0.1 ‘ ’ 1
| Particulars | Value | Particulars | Value | |
| F-Statistic | 3.673 | Multiple R-squared | 0.1068 | |
| p-value | 0.0009051 | Adjusted R-squared | 0.07774 |
Discussion:
From the R-output, it is found that, Multiple R-squared is 0.1068 that means in the aspect of loss aversion bias about 10.68% total variation can be explained by the set of independent variables. The estimated regression equation reveals that the p-value of the Sex Male is 0.0156 which is less than 0.05 that means this demographic factor is significant for affecting the loss aversion bias. It also reveals that, the p-value of the Education Masters is 0.0000958 which is less than 0.05 that means this demographic factor is also significant for affecting the loss aversion bias.
Model-5:
Self-Attribution Bias = 𝛽0 + 𝛽1Age+ 𝛽2SexMale + 𝛽3EducationHSC + 𝛽4 EducationMasters + 𝛽5 EducationMBBS + 𝛽6 EducationOthers + 𝛽7 Experience + εi (i = 1, 2, 3, …., 223)
The response variable in the above model is Self-Attribution Bias, whereas, the Age, Sex Male, Education HSC, Education Masters, Education MBBS, Education Others and Experiences are the independent variables.
Besides, to check whether the above model is adequate for estimating the impact of demographic factors on self-attribution bias, conducted the F-test with the following null and alternative hypothesis;
H0 : 𝛽0 = 𝛽1 = 𝛽2 = ……… = 𝛽7 = 0, against
H1 : 𝛽i ≠ 0 (i = 0, 1, ……., 7), at least one occurs.
I found that, the p-value is 0.06058 which is greater than 0.05. So, I do not reject the null hypothesis at 5% level of significance. Hence, the model is not adequate for estimating the impact of demographic factors on self-attribution bias.
Regression Analysis
In Order to identify the impact of independent variables (Age, Sex Male, Education HSC, Education Masters, Education MBBS, Education Others and Experiences) on dependent variable (Self-Attribution Bias), I tried to execute the Multiple Regression Model using R-Studio software and found the following results which are given in the table format. The output of the R-Studio is given in the appendix-E.
Table-8: Different values of Multiple Linear Regression Analysis using Model-5
| Coefficients | Estimate | Std. Error | Pr (>|t|) |
| (Intercept) | 3.39413 | 0.62951 | 1.83e-07*** |
| Age | 0.02038 | 0.01443 | 0.15918 |
| SexMale | -0.26307 | 0.28379 | 0.35498 |
| EducationHSC | -0.43373 | 0.70492 | 0.53902 |
| EducationMasters | -0.44061 | 0.28877 | 0.12853 |
| EducationMBBS | -0.33166 | 0.65813 | 0.61482 |
| EducationOthers | -1.22121 | 0.83247 | 0.14385 |
| Experience | -0.05268 | 0.01865 | 0.00518** |
Signif. codes: 0 ‘***’ 0.001 ‘**’ 0.01 ‘*’ 0.05 ‘.’ 0.1 ‘ ’ 1
| Particulars | Value | Particulars | Value | |
| F-Statistic | 1.969 | Multiple R-squared | 0.06024 | |
| p-value | 0.06058 | Adjusted R-squared | 0.02964 |
Discussion:
From the R-output, it is found that, Multiple R-squared is 0.06024 that means in the aspect of self-attribution bias about 6.02% total variation can be explained by the set of independent variables. The estimated regression equation reveals that the p-value of the Experience is 0.00518 which is less than 0.05 that means this demographic factor is significant for affecting the self-attribution bias.
9. CONCLUSION
Based on the findings of the study, the following conclusions can be drawn:
In case of illusion of control bias the independent variable Sex Male is the only demographic factor that is significant for generating the impact on the illusion of control bias but not the other demographic factors like age, education and experience.
In case of cognitive bias all the independent variables of the demographic factors are found not significant for generating any impact on the cognitive bias i.e. age, gender, education and experience.
In case of herd instinct bias all the independent variables of the demographic factors are found not significant for generating any impact on the herd instinct bias i.e. age, gender, education and experience.
In case of loss aversion bias the independent variable Sex Male and Education Masters are the demographic factors that are very much significant for generating the impact on loss aversion bias but not the other demographic factors like age and experience.
In case of self-attribution bias the independent variable Experience is the only demographic factor that is significant for generating the impact on self-attribution bias but not the other demographic factors like age, gender and education.
Overall, the study suggests that there are some relationship exists between demographic factors and behavioral biases of individual investors in the capital market of Bangladesh. However, the specific relationships vary depending on the type of bias and demographic factor examined. Further research is needed to fully understand the relationship between demographic factors and behavioral biases in the Bangladesh capital market.
10. REFERENCES
| 01 | Beatrice, V., Werner M., Herlambang, A., (2021), The effect of demographic factors on behavioral biases, Jurnal Siasat Bisnis, Vol. 25, No. 1, 17-29. |
| 02. | Dev, M., Dahal, P., Shrestha, I., Shrestha, D., & Sah, P., (2023), Demographic factors and Behavioral Biases of Individual Investors in Nepalese Capital Markets. New Perspective: Journal of Business and Economics (ISSN: 2382- 5391) 6 (1), 52-63. |
| 03. | Fatima, A., Shafi, S. M., (2016), Impact of Demographics on the Investment Behavior of Individual Investors of Kashmir, Global Journal for Research Analysis, Volume-5, Issue-7, ISSN No. 2277-8160. |
| 04. | Ghosh, S. K., (2022), Demographic Aspects And Investors’ Decision Making Process: A Study, Journal of Asian Business Strategy, Vol. 12, No. 2, 150-162. |
| 05. | Khanam, Z., (2017), The Impact of Demographic Factors on the Decisions of Investors during Dividend Declaration: A Study on Dhaka Stock Exchange, Bangladesh, IOSR Journal of Business and Management (IOSR-JBM), vol. 19, issue 8, pp 01–07. |
| 06. | Perera, A. M., (2016), Gender Attitudes and Investor Behaviour: Evidence From Individual Investors In North Western Province, Sri Lanka Journal of Economic Research Volume 4 (1), SLJER.04.01.01, pp. 3-17, Sri Lanka Forum of University Economists. |
| 07. | Sadiq, M. N., & Ishaq, H. M., (2014), The Effect of Demographic Factors on the Behavior of Investors during the Choice of Investment: Evidence from Twin Cities of Pakistan, Global Journal of Management and Business Research: C Finance, Volume 14, Issue 3, Version 1.0. |
| 08. | Sharma, A., (2020), Effect of Demographic Factors in Investment Decisions of Individual Investors-A Case Study in Delhi NCR, International Conference of Advance Research & Innovation (ICARI). SSRN: https://ssrn.com/abstract=3559248 or http://dx.doi.org/10.2139/ssrn.3559248 |
| 09. | Yasmin, F., Ferdaous, J., (2023), Behavioral biases affecting investment decisions of capital market investors in Bangladesh: A behavioral finance approach, Investment Management and Financial Innovations 20(2):149-159. |
11. APPENDICES
Appendix-A
R-output:
model1 <- lm(`Illusion_of Control_Bias`~ Age + Sex + Education + Experience)
> summary(model1)
Call:
lm(formula = `Illusion_of Control_Bias` ~ Age + Sex + Education +
Experience)
Residuals:
Min 1Q Median 3Q Max
-2.03641 -0.51884 0.06431 0.59678 1.58499
Coefficients:
Estimate Std. Error t value Pr(>|t|)
(Intercept) 3.951034 0.311040 12.703 < 2e-16 ***
Age 0.004138 0.007128 0.581 0.56213
SexMale -0.413824 0.140221 -2.951 0.00352 **
EducationHSC 0.543066 0.348302 1.559 0.12042
EducationMasters -0.250774 0.142682 -1.758 0.08024 .
EducationMBBS -0.076260 0.325180 -0.235 0.81481
EducationOthers -0.204398 0.411324 -0.497 0.61975
Experience 0.010486 0.009215 1.138 0.25639
—
Signif. codes: 0 ‘***’ 0.001 ‘**’ 0.01 ‘*’ 0.05 ‘.’ 0.1 ‘ ’ 1
Residual standard error: 0.7756 on 215 degrees of freedom
Multiple R-squared: 0.09407, Adjusted R-squared: 0.06457
F-statistic: 3.189 on 7 and 215 DF, p-value: 0.003116
Appendix-B
R-output:
> model2 <- lm(Cognitive_Bias~ Age + Sex + Education + Experience )
> summary(model2)
Call:
lm(formula = Cognitive_Bias ~ Age + Sex + Education + Experience)
Residuals:
Min 1Q Median 3Q Max
-2.95077 -0.05235 0.13562 0.93809 1.52497
Coefficients:
Estimate Std. Error t value Pr(>|t|)
(Intercept) 3.363317 0.465325 7.228 8.44e-12 ***
Age 0.008197 0.010664 0.769 0.443
SexMale -0.124616 0.209776 -0.594 0.553
EducationHSC 0.652791 0.521070 1.253 0.212
EducationMasters 0.311540 0.213457 1.460 0.146
EducationMBBS -0.268800 0.486480 -0.553 0.581
EducationOthers 0.092632 0.615354 0.151 0.880
Experience 0.001359 0.013785 0.099 0.922
—
Signif. codes: 0 ‘***’ 0.001 ‘**’ 0.01 ‘*’ 0.05 ‘.’ 0.1 ‘ ’ 1
Residual standard error: 1.16 on 215 degrees of freedom
Multiple R-squared: 0.02616, Adjusted R-squared: -0.005541
F-statistic: 0.8252 on 7 and 215 DF, p-value: 0.5673
Appendix-C
R-output:
> model3 <- lm(Herd_Instinct_Bias~ Age + Sex + Education + Experience )
> summary(model3)
Call:
lm(formula = Herd_Instinct_Bias ~ Age + Sex + Education + Experience)
Residuals:
Min 1Q Median 3Q Max
-2.78864 0.01450 0.03663 1.00682 1.23802
Coefficients:
Estimate Std. Error t value Pr(>|t|)
(Intercept) 3.7564516 0.4033286 9.314 <2e-16 ***
Age 0.0004439 0.0092429 0.048 0.962
SexMale -0.0138240 0.1818268 -0.076 0.939
EducationHSC 0.2196427 0.4516465 0.486 0.627
EducationMasters 0.1915707 0.1850172 1.035 0.302
EducationMBBS -0.0701786 0.4216651 -0.166 0.868
EducationOthers 0.7183194 0.5333684 1.347 0.179
Experience 0.0013843 0.0119486 0.116 0.908
—
Signif. codes: 0 ‘***’ 0.001 ‘**’ 0.01 ‘*’ 0.05 ‘.’ 0.1 ‘ ’ 1
Residual standard error: 1.006 on 215 degrees of freedom
Multiple R-squared: 0.01263, Adjusted R-squared: -0.01952
F-statistic: 0.3928 on 7 and 215 DF, p-value: 0.9059
Appendix-D
R-output:
> model4 <- lm(Loss_Aversion_Bias~ Age + Sex + Education + Experience )
> summary(model4)
Call:
lm(formula = Loss_Aversion_Bias ~ Age + Sex + Education + Experience)
Residuals:
Min 1Q Median 3Q Max
-2.6837 -0.8013 -0.5231 1.2889 2.9371
Coefficients:
Estimate Std. Error t value Pr(>|t|)
(Intercept) 4.237362 0.531433 7.973 9.02e-14 ***
Age 0.003847 0.012179 0.316 0.7524
SexMale -0.584007 0.239578 -2.438 0.0156 *
EducationHSC -1.111087 0.595097 -1.867 0.0633 .
EducationMasters -0.969238 0.243782 -3.976 9.58e-05 ***
EducationMBBS -0.614667 0.555594 -1.106 0.2698
EducationOthers -1.314109 0.702776 -1.870 0.0629 .
Experience -0.022221 0.015744 -1.411 0.1596
—
Signif. codes: 0 ‘***’ 0.001 ‘**’ 0.01 ‘*’ 0.05 ‘.’ 0.1 ‘ ’ 1
Residual standard error: 1.325 on 215 degrees of freedom
Multiple R-squared: 0.1068, Adjusted R-squared: 0.07774
F-statistic: 3.673 on 7 and 215 DF, p-value: 0.0009051
Appendix-E
R-output:
> model5 <- lm(Self_Attribution_Bias~ Age + Sex + Education + Experience )
> summary(model5)
Call:
lm(formula = Self_Attribution_Bias ~ Age + Sex + Education + Experience)
Residuals:
Min 1Q Median 3Q Max
-2.6456 -1.2514 -0.1594 1.4802 2.9728
Coefficients:
Estimate Std. Error t value Pr(>|t|)
(Intercept) 3.39413 0.62951 5.392 1.83e-07 ***
Age 0.02038 0.01443 1.413 0.15918
SexMale -0.26307 0.28379 -0.927 0.35498
EducationHSC -0.43373 0.70492 -0.615 0.53902
EducationMasters -0.44061 0.28877 -1.526 0.12853
EducationMBBS -0.33166 0.65813 -0.504 0.61482
EducationOthers -1.22121 0.83247 -1.467 0.14385
Experience -0.05268 0.01865 -2.825 0.00518 **
—
Signif. codes: 0 ‘***’ 0.001 ‘**’ 0.01 ‘*’ 0.05 ‘.’ 0.1 ‘ ’ 1
Residual standard error: 1.57 on 215 degrees of freedom
Multiple R-squared: 0.06024, Adjusted R-squared: 0.02964
F-statistic: 1.969 on 7 and 215 DF, p-value: 0.06058