Pran RFL Group Internship Report On Financial Performance Analysis of Pran RFL Group
Financial Performance Analysis of Pran RFL Group
Table of contents
Chapter 1:
- Introduction
- Background of study
- Objective of study
- Methodology of the study
- Limitation of the study
Chapter 2:
Company Background
2.1. Company profile
2.2. Mission
2.3. Vision
2.4. Core Value
2.5. Corporate Division of RFL Group
2.6 . Organogram of Accounts and Finance Department at RFL Group(HQ)
2.7. Details of Product Lines
2.8. RFL Sister concern
2.9. Corporate social responsibilities
Chapter 3:
Theoretical background
3.1 Financial performance and Tools Analysis
Chapter 4:
Analysis and Findings
4.1 Horizontal Analysis
4.2 Common Size Income Statements
4.3 Financial Ratio Analysis
4.4 Findings
Chapter 5:
Recommendations and Conclusion
5.1 Recommendation
5.2 Conclusion
References
Financial Performance Analysis of Pran RFL Group
Chapter: 1
Introduction
- Introduction
Financial statements are used by a company entity to share information about its finances with interested parties, such as creditors and investors. To offer comprehensive information on a corporate entity’s financial situation at specific points in time and its financial performance over specific periods, four financial statements must be created. The four financial statements cover a wide range of topics, including net income, cash flows, shareholders’ equity, and assets, liabilities, and shareholders’ equity.
PRAN-RFL Group is one of the largest conglomerates in Bangladesh. It is the largest agribusiness & plastic product manufacturer in Bangladesh. The Pran RFL group consists of two groups. One is Pran group, another is RFL group.One of the biggest producers of plastic in the world is RFL (3rd largest in Asia).
The group generates a turnover of close to USD $0.5 billion every year. In this report the financial performances of Pran-RFL have been analyzed by using the help of some financial tools and techniques like trend analysis, common size income statement and ratio analysis.
1.2. Background of study
It is compulsory to have a practical application of the knowledge acquired from any academic course of the study. Because even extensive theoretical knowledge will be meaningless in the real world. A competent student will put their theoretical knowledge to good use by applying it correctly in order to gain some benefit from it and make it more profitable. It would be possible to submit such an application through internships.
The internship program is crucial because it allows students to experience how real-world businesses operate. While working with an organization’s employees, the student gains knowledge of its operations. Students get the opportunity to sharpen their intellectual prowess and analytical abilities in these courses.
1.3. Objective of the study
- Main objectives: The main objective of this report is to analyze the financial performance of Pran-RFL Group.
- Specific Objectives:
* To gather knowledge about the financial performance tools used to analyze the financial performance .
* To evaluate the financial performance of Pran-RFL Group.
* To find out some lacking, shortcomings related to financial issues.
* To provide some suggestions based on findings.
1.4. Methodology of the study
All the information in this report has been collected via primary and secondary sources:
- Annual Reports of Pran-RFL Group
- Relevant papers and different books
- Company official websites
And for calculating the ratio analysis for the report given tools were used:
- Horizontal Analysis
- Common size income statement
- Ratio Analysis
1.5. Limitations of the study
Although I have received adequate co-operation from my supervisor and all the associated employee of Pran-RFL group but most of the information were confidential, with which I worked. Hence, it was very difficult for me to provide detailed information on about my work as an intern at RFL group .Also Cost accounts sector is a core component and deals with sensitive data, maintaining privacy was one of my job responsibilities as well.
Due to such concerns, it was not much possible for me to include sufficient amount of images related to my work in this report. In addition I was not entrusted with confidential work as I was an intern. It has been challenging to create a remarkable report as my final undergraduate degree completion.
Read More:
Chapter: 2
Company Profile:
2.1. Company Profile
Rangpur Foundry Ltd (RFL) was founded by Major General Amjad Khan Chowdhury(Retd) in 1981.Chairman & Chief Executive Officer (CEO) of Pran-RFL Group Ahan khan Chowdhury. Managing Director (MD) of RFL Group R.N. PAUL. Today this company has its wide ranges of CI products like pumps, tube wells, bearings, gas stoves, etc.
and has achieved prestige as the largest cast iron foundry and light engineering workshop in Bangladesh .Over its 40 years of journey RFL has a wide range of products which include plastic products, PVC, metal, electronics, wooden furniture, Paint, Stationary, Footwear, Bicycle, Medical device, Real State, Road Construction etc.
Currently they have 13 factories all over Bangladesh. This are listed below: Rangpur Foundry Limited, BSCIC. Rangpur Habiganj Industrial Park, Olipur, Habiganj. Palash Industrial Park, Palash, Narshingdi. Kaligonj Industrial Park, Kaligonj, Gazipur.
Danga Industrial Park, Danga, Narshingdi. Ganga Foundry Limited (GFL) – Rangpur. Rangpur Metal Industries limited – RMIL Rupgonj (rflbd, n.d.). Recently they are building 3 factories in Bangladesh and also they are planning to build 5 factories by 2025. They are maintaining a huge number of depot to meet the local and global markets in time.
2.2. Mission
‟ PRAN-RFL mission reflects that they want to create employment in the nation, through which they want to eradicate poverty. Their mission is, “Poverty and hunger are curses”, and their aim is “to generate employment and earn dignity and self-respect for our compatriots through profitable enterprises (RFL, n.d.)”.
2.3. Vision
Their vision has a similarity with the work they are doing, diversifying their products and making employments for country. Their vision is “Improving Livelihood (RFL, n.d.)
2.4. Core Value
RFL believes in providing quality by considering the customers’ demands and expectations. Continuous innovation and improvement is the motive of this organization by focusing customers and tries to maintain fairness and transparency in all segments. The corporate values for RFL are Consumer care, Supplier care, Employee care, Trade care.
2.5. Corporate Divisions of RFL Group
There are more than 12 departments of the RFL group. Under each of this departments, there are many sub departments included.
* Accounts & Finance Department:
There are six teams working in this department:
a. General Accounts Team:Maintaining day to day transaction. Inputting GL in oracle software every day. Preparing trial balance. Making a cash flow statement balance sheet. Maintain Bank reconstitution, sales report group wise.
b. Cost Accounts Team : The prime responsibility is to calculate the direct and indirect cost of a product then setting price for that product. Other responsibilities are preparing income statements. Preparing budget, preparing raw material consumption report, checking different variance, analysis the cost, Preparing finished goods reconciliation, financial analysis such as ratio analysis, NPV, IRR, Visiting factory and doing cost audit. Apart from these there are many responsibilities that a cost accountant has to do.
c. Hire Purchase Accounts Team:They observe all the showrooms of RFL (Vision emporium, regal emporium, best buy, Vigo showroom. The main responsibility of this team is to check whether showroom managers collect the installment (EMI) properly from the credit purchaser. This team maintains all the documents and customers’ profiles. Showroom audit is another responsibility of the HP team. They audit showrooms sometimes to find error and any fraudulent activities. They sometimes send a CPD team from the regal Department.
d. Sales Service Accounts Team: They receive cash amounts from different parties who purchase RFL products. Also they collect accounts receivable from different parties all over the world. For every group of RFL there are at least one accounts working in the sales support team.
e. Distribution Accounts Team: Their primary activities are to maintain all the transactions of RFL deports. RFL has a storage station called RFL Depot. There are many deport all over the countries. From where products are distributed. Such as- RFL depot in Khulna, Bogura, Sylhet, Dhaka etc.
All the companies of RFL use deport. This team calculates the monthly distribution cost and also allocated the distribution cost for all the companies. They also supervise how much inventory is in and out. Collecting money from cash on delivery and product home delivery of Othoba.com.
f. Internal Fund Team: They deal with cash balance and bank amount generated from within the company. Their main funding sources are found within the company’s assets and revenues .They give salaries of all department’s employees. RFL has so far 17 departments, under each department at least 3-4 team or sub sections are working. If those departments require any money, this team will give that fund. All the expenses that exist in the head office give the money. Like utility bills, canteen bills, employees salary, etc.
g. Audit and Assurance Department:In RFL group there is an individual department for internal audit. There are some types of audits which are followed by Internal Audit Department to maintain the corporate governance in RFL. The different types of audits are discussed below: Prepayment Audit, Surprise Audit: Surprise can be conducted in two different places these are:
- Depot Audit:There are many depots of RFL group in different regions of Bangladesh. Mainly two types of audit conducted in depots: Cash management audit and inventory management audits are conducted there.
- Showroom Audit: Showroom audit is as like as depot audit .There are different showrooms in different locations all over the Bangladesh of RFL group. There are vision showrooms, Vigo electronics showroom, Best buy, regal emporium. Auditors go to the showroom visits for checking the stocks and cash.
- Special text and investigation: This department also does special text and investigation. When Special requests come from the management level then special audits and investigation is performed. When there is any urgent need that means outside the plan any necessary task need to be accomplished then this processes are applied.
h. Admin Department:Functions of Admin Department of RFL group are general office management, security and safety Management, internal asset management, management canteen and cafeteria of all the factories of RFL and RFL HQ. This department mainly ensures a clean and orderly office environment, manages physical capital assets of the company in terms of building installations, office space improvements, Furniture, equipment etc. Normally they maintain the internal office of RFL group (HQ) and all the factories.
- Human Resource Department:The functions of this department are human resource planning, recruitment and selection of candidates for CS- RFL and RFL factories, training and development, organizational development, remuneration. There are number of sub department exists in this department: Payroll management team:
They manage salary all the employees and worker of RFL. Organizational development Team: This team responsible for improving the origination to bringing Changes. Training and Development Team: This team oversees the training needs of the employees. They arrange training and development programs for all the employees and workers of this group.
j. Performance Appraisals & Promotions Team: They maintain HRIS software to monitor everything on employees. These are maintained by Performance management team. Apart from these department, some others team are working under this department such as Talent and acquisition team, Programmed team etc.
k. Sales Department:They have 8 types of sales teams. Dealer sales team, Corporation sales team, Institutional sales team, SR sales team, tender sales team, export sales team, online sales team, Intercompany sales team etc. Each of these teams are working for sales activities. They receive orders from different parties.
l. Marketing department:Marketing Department of RFL group plays a vital role in promoting the business. They are mainly involved in producing marketing and promotional material, brand management, and digital marketing. Conducting customer and market Research, and overseeing outside vendors and agencies. Number of sub departments are there such as market communication team, IMC team, market research team.
m. Legal Department:The legal department of a business handles legal issues that may come up in the course of business. This department may represent a business in the event a lawsuit is filed. As RFL group is one of the largest therefore the regal department is significant for them. They have to sue media like TV channel, newspapers for fake rumors of RFL business. There is a team called CPD team. They worked in this department.
n. Corporate Affairs:
Corporate Affairs in RFL are responsible for all internal company and external relation with a Local government and foreign government. They manage and responsibility for external and internal process in the company. They also maintain a good relation with external parties. Apart from these department, some of corporate division are included in RFL group (HQ): MIS, IT, Export Department, Production department, Operation Department, Distribution Department, SCM Department, Engineering Department and Finance Department.
2.6. Organ gram of Accounts Department at RFL group (Head Office)
Executive Director/CFO
2.7. Details of Product Lines
RFL consists of 25 individual companies. Under these Companies, large number of businesses is there. Though these brand RFL currently is offering more than 6500 products.
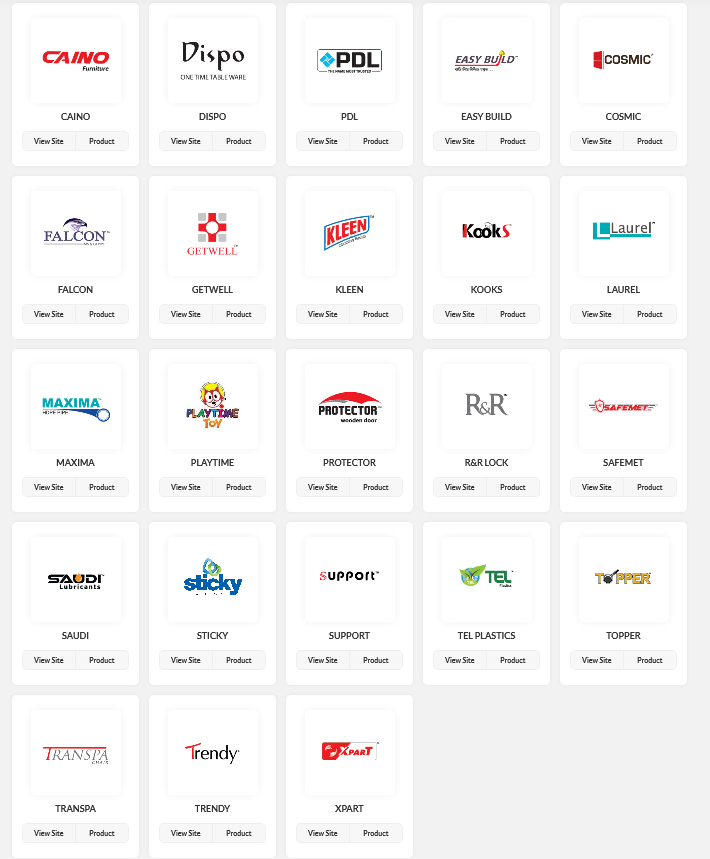
2.8.RFL Sister Concern
- Durable Plastic Limited (DPL)
- RFL Plastic Limited (RPL)
- Banga Building Marital Limited (BBML)
- Rangpur Metal Industry Limited (RMIL)
- All-Plast Bangladesh Limited (APBL)
- Banga Plastic Limited (BPIL)
- Bangladesh Lift Industry Limited (BLIL)
- Multiline Industry Limited (MLIL)
- Rangpur Foundry Limited (RFL)
- Trade Environment Limited (TEL)
- Accessories World Limited (AWL)
- Habiganj Ceramics Limited (HCL)
- Habiganj Glassware Limited (HGL)
- Habiganj Metal Industries Limited (HMIL)
- RFL Exports Limited (REL)
- BBML TANK (BBMLT)
2.9. Corporate Social Responsibilities
RFL’s CSR activities are based upon 4 pillars, Healthcare, Education, Community Development and Environment. They strongly ensure their activities are sustainable and benefit the community for the future. RFL involve lot of CSR activities. Some of resent project are given below:
∙ Pashe Achi Bangladesh:
Pran-RFL group jointly began this campaign during COVID-19. This program was initiated for struggling people who are in need of support. Through this project they assists helpless, unemployed and low income people in various disasters. They have served almost 500,000 families so far. They have provided relief food, masks, sanitizers, oxygen.
∙ Ahar Hobe Shobar Ghore :
This campaign was initiated during Covid-19. They had given a number. Under-privileged people can call for help. Not only the poor, but anyone in the food crisis due to the Corona epidemic can call 02222261792 and emergency food will reach home. RFL have also provided relief and support to various institutions like school, defense etc. and to help victims of human trafficking, RFL jointly works with Win rock International and provided relief training to migrant workers.
They have established two highly equipped hospitals – Sun Health Care Foundation & Amjad Khan Chowdhury Memorial Hospital. Every company of the RFL group is involved in SCR activities, even a group involved in CSR activities. For example: TEL plastics group initiated a beach cleaning program and relief foods providing program in flood affected areas. RFL plastics initiated a food aid program for 2000 families.
Read More:
Chapter 3
Theoretical background
3.1. Financial Performance Analysis
The evaluation of financial data in order to make business decisions is known as financial analysis. This analysis typically results in the reallocation of resources to or from a business or a specific internal operation.The financial accounts of a company are the main source of data for financial analysis. These records are used by the financial analyst to calculate ratios, create trend lines, and conduct comparisons against similar information for comparable firms.. Any of the following choices could be the result of financial analysis:
* Whether to invest in a business, and at what price per share.
* Whether to lend money to a business, and if so, what terms to offer.
* Whether to invest internally in an asset or working capital, and how to finance the acquisition.
One of the most important tools business managers use to assess how their organization is doing is financial analysis. They frequently ask the financial analyst about their company’s profitability, cash flows, and other financial matters as a result.In this report, they analyzed the financial statement of Pran- RFL Group in three ways. These are:
* Horizontal Analysis
* Common Size Income Statement
* Financial Ratio Analysis
- Horizontal Analysis: A company’s financial statements for a single accounting period can reveal important information about its performance and financial health. We can compare financial statements for more than one period by using Horizontal Analysis. Horizontal analysis, also called “trend analysis,” is used to discover trends in the earnings, assets and liabilities of a company over the course of several years. With horizontal analysis, we compare the amount changes of each item in a financial statement for two consecutive periods.In this horizontal analysis of the financial statement, here all the particulars from the 2018 to 2021 have shown by the amount, increase or decrease in the amount.
B. Common Size Income Statements
The common-size income statement is a financial statement that expresses all items as a percentage of total revenues, so it’s simple to compare and analyze companies within an industry.
In financial statement analysis, the common-size income statement is typically used to compare businesses in the same industry or in other industries, as well as to compare time periods within the same business. To put it simply, a common size income statement is one in which the accounts are each expressed as a percentage of the sales value. It is a well-known method for comparing a company’s financial statements.
c. Financial Ratio Analysis
Financial ratio analysis is a tool for investigating and comparing relationships between different pieces of financial information. Financial ratios can be calculated by any corporation using the data from their income statement and balance sheet. A ratio analysis is a quantitative analysis of data from financial accounts of a corporation. Ratio analysis is a tool used to assess the efficiency, liquidity, profitability, and solvency of a company’s operating and financial performance. Below are the ratios :
Categories of Financial Ratios:
Financial ratios can be divided for convenience into 4 basic categories:
- Liquidity
- Activity
- Debt
- Profitability
Liquidity, activity, and debt ratios primarily measure risk. Profitability ratios measure return. As a rule, the inputs necessary to an effective financial analysis include, at a minimum, the income statement and the balance sheet. We will use the 2018 to 2021 income statements and balance sheets for Pran-RFL Group.
- Liquidity Ratio
The liquidity of a firm is measured by its ability to satisfy its short-term obligations as they come due. Liquidity refers to the solvency of the firm’s overall financial position—the ease with which it can pay its bills. Because a common precursor to financial distress and bankruptcy is low or declining liquidity, these ratios are viewed as good leading indicators of cash flow problems. The two basic measures of liquidity are:
- Current ratio
- Quick (acid-test) ratio
- Net Working Capital Ratio
- Current Ratio: The current ratio is a financial ratio that shows the proportion of current assets to current liabilities. The current ratio is used as an indicator of a company’s liquidity. In other words, a large amount of current assets in relationship to a small amount of current liabilities provides some assurance that the obligations coming due will be paid. The ideal current ratio is 2:1. It is expressed as follows:
Current Ratio = Current Assets Current Liabilities
- Quick (Acid-Test) Ratio:The quick ratio is a financial ratio used to gauge a company’s liquidity. The quick ratio is also known as the acid test ratio. The quick (acid-test) ratio is similar to the current ratio except that it excludes inventory, which is generally the least liquid current asset. A reliable test of liquidity is the quick ratio test that excludes inventory from current asset. It considered the ability to use its quick assets to pay its current liabilities. This approach can be acceptable since inventory of many companies cannot be quickly converted into cash. The ideal quick ratio is 1:1. The quick ratio is calculated as follows:
Quick Ratio (Acid-Test Ratio) = Current assets−Inventory Current Liabilities
3. Net Working Capital Ratio: The working capital ratio (Current Assets/Current Liabilities) indicates whether a company has enough short term assets to cover it sort term debt.
Working Capital = Current Assets – Current Liabilities
Net Working Capital Ratio= Net working capital Net Assets
B. Activity Ratios
Activity ratios assess the efficiency of operations of a business. For example, these ratios attempt to find out how effectively the business is converting inventories into sales and sales into cash, or how it is utilizing its fixed assets and working capital, etc. A number of ratios are available for measuring the activity of the most important current accounts, which include inventory, accounts receivable, and accounts payable. The efficiency with which total assets are used can also be assessed.
1. Inventory Turnover Ratio:Inventory turnover is an efficiency ratio which calculates the number of times per period a business sells and replaces its entire batch of inventories. It is the ratio of cost of goods sold by a business during an accounting period to the average inventories of the business during the period. The standard inventory turnover ratio is 4:1.
Inventory Turnover Ratio = Cost of Good Sold Average Inventory
2. Total Asset Turnover Ratios:Fixed assets turnover ratio is an activity ratio that measures how successfully a company is utilizing its fixed assets in generating revenue. So a higher ratio is always more favorable. Higher turnover ratios mean the company is using its assets more efficiently. Lower ratios mean that the company isn’t using its assets efficiently and most likely have management or production problems.For instance, a ratio of 1 means, the net sales of a company equals the average total assets for the year.
In other words, the company is generating 1 dollar of sales for every dollar invested in assets.
Total Asset Turnover Ratios = Sales or Revenue Total Assets
C. Debt Ratio
1. Debt Ratio:Debt ratio is a ratio which measures debt level of a business as a percentage of its total assets. It is calculated by dividing total debt of a business by its total assets.Debt ratio finds out the percentage of total assets that are financed by debt and helps in assessing whether it is sustainable or not. If the percentage is too high, it might indicate that it is too difficult for the business to pay off its debts and continue operations.The debt ratio measures the proportion of total assets financed by the firm’s creditors. The higher this ratio, the greater the amount of other people’s money being used to generate profits. The ratio is calculated as follows:
Debt Ratio = Total liabilities Total Assets100
- Profitability Ratios
The Profitability Ratio measure the overall performance of the company in terms of the total revenue generated from its operations. In other words, the ratios that measure the capacity of a firm to generate profits out of the expenses and the other costs incurred over a period are called the Profitability Ratios. There are different types of Profitability Ratios. These are given below:
- Gross Profit Margin:Gross margin ratio is the ratio of gross profit of a business to its revenue. It is a profitability ratio measuring what proportion of revenue is converted into gross profit.The higher the gross profit margin, the better The gross profit margin is calculated as follows:
Gross Profit Margin = Gross Profits Sales or Revenue
- Operating Profit Margin:Operating margin ratio or return on sales ratio is the ratio of operating income of a business to its revenue. It is profitability ratio showing operating income as a percentage of revenue. The operating profit margin is calculated as follows:
Operating Profit Margin = Operating Profits Sales or Revenue
- Return on Total Assets (ROA): Return on assets is the ratio of annual net income to average total assets of a business during a financial year. It measures efficiency of the business in using its assets to generate net income. It is a profitability ratio. Higher Return on Total Assets for the company is better. The return on total assets is calculated as follows:
Return on Total Assets (ROA) = Earning available for Common StockℎoldersTotal Assets
- Return on Common Equity (ROE):Return on equity or return on capital is the ratio of net income of a business during a year to its stockholders’ equity during that year. It is a measure of profitability of stockholders’ investments. It shows net income as a percentage of shareholder equity.
Return on Equity = Net Income available for Common StockholdersStock Holder’s Equity
Read More:
Chapter 4
Analysis and Findings Part
*Analysis and Findings
To analyze the financial performance all calculation as like horizontal analysis, common size income statements and ratio analysis are given as follow:
4.1 A.Horizontal Analysis (Trend Analysis):
The horizontal analyses of Pran-RFL Group are given below as a table:
- Revenue
| Particulars | 2018 | 2019 | 2020 | 2021 |
| Revenue or sales | 15,349,500,312 | 16,044,323,150 | 18,022,403,205 | 19,442,002,035 |
| Increase or Decrease | 1,535,122,478 | 2,228,120,458 | 1,415,581,142 | |
| Increase or Decrease(Percentage) | 10% | 13.88% | 7.85% |
Pran-RFL Group2018 to 2021 Revenue (Amount in BDT):
Interpretation:During the Four years (2018-2021) of study the total growth of revenue of PRAN-RFL Group was increased. The revenue has changed significantly each year, as shown in the table above.In 2019 revenue was increased 10% than 2018. In 2020 the highest increase, which was 13.88% in revenue, occurred compared with the other years but in 2021, the changes in revenue decline were 7.85% compared to 2018. But it has been clear that there is an increasing trend in the changes of revenue. So,the company’s overall revenue is growing every year, which results in sufficient sales.
B.Operating Profit
Pran-RFL Group 2018-2021Operating Profit (Amount in BDT):
| Particulars | 2018 | 2019 | 2020 | 2021 |
| Operating Profit | 1,853,472,920 | 2,188,732,330 | 2,001,233,471 | 1,857,561,676 |
| Increase or Decrease | 321,347,330 | (184,497,783) | (143,671,805) | |
| Increase or Decrease(Percentage) | 6% | 12% | 14% |
Interpretation:During the four years (2018-2021) of study the total growth of operating profit of Pran -RFL Group were decreased. From the above table, there significant changes have occurred in operating profit in each year. In base year 2018Operating profit was BDT 1,853,472,920. As here, 2018 to 2019Operating profit increased 6%(BDT 321,347,330). In the next year 2020, the changes in operating profit have been decreased 12% (BDT 2,188,732,330 to BDT 2,001,233,471).And last year 2021 operating profit was 14% decreased from 2020 .That’s concern for Pran-RFL Group.
c.Profit after Tax
Pran -RFL Group 2018-2021Profit After Tax( Amount in BDT):
| Particulars | 2018 | 2019 | 2020 | 2021 |
| Profit after tax | 1,148,195,255 | 2,353,611,059 | 4,18,35,31,914 | 4,147,360,335 |
| Increase or Decrease | 1,205,415,803 | 1,829,920,868 | (36,171,589) | |
| Increase or Decrease(Percentage) | 9.5% | 12.8% | -1.15% |

Interpretation:During the four years (2018-2021) of study the total growth of profit after tax of PRAN-RFL Group were fluctuated. As here, 2018 is the base year profit after tax was BDT1,148,195,255. In 2019 profit after tax increased 9.5%( BDT 205,415,803).In the next year 2020, the profit after tax has been slightly increased 12.8%(BDT 2,829,920,868 )than the previous year .But in 2021, the changes in profit after tax decline 1.15% and the declining amount was BDT (36,171,589).So, in each year company’s profit after taxation is increasing which makes the company can invest more money for their business purpose as well as the company can pay more dividends to their shareholders.
D.Total Assets
Pran-RFL Group(2019 to 2021) Total Assets (Amount in BDT):
| Particulars | 2018 | 2019 | 2020 | 2021 |
| Total Assets | 18,315,098,199 | 19,395,912,591 | 23,837,913,397 | 27,971,437,641 |
| Increase or Decrease | 1,080,814,392 | 4,442,000,806 | 4,133,524,244 | |
| Increase or Decrease(Percentage) | 16.94% | 24.68% | 22.36% |
Interpretation:During the four years (2018-2021) of study the total growth of total assets of Pran-RFL were increased. There significant changes have occurred in total assets in each year. As here, 2018 is the base year total assets was BDT 18,315,098,199.The changes in total assets have been increased from 2019 to 2021. The largest gain in total assets was 24.68% in 2020, however in 2021 there was a modest fall in total assets compared to 2020, and the decline was 22.36%. Although it has been clear that day by day there is an increasing trend in the changes of total assets.Its sounds good for the company.
E.Total Liabilities
Pran – RFL Group 2018-2021Total Liabilities (Amount in BDT):
| Particulars | 2018 | 2019 | 2020 | 2021 |
| Total Liabilities | 13,035,724,749 | 12,932,637,973 | 11,983,746,103 | 14,321,932,821 |
| Increase or Decrease | (103,086,776) | (1,051,978,646) | 2,338,186,718 | |
| Increase or Decrease(Percentage) | 12.6% | 12% | 32.2% |
Interpretation:During the four years (2018-2021) of study the total growth of total liabilities of Pran RFL Group were fluctuated.The total liabilities have seen major fluctuations each year. As here, 2018 is the base year total liabilities was BDT13,035,724,749.Total liabilities decreased 12.6% in 2019 and 12% in 2020 to 2018, while in 2021 changes in total liabilities increased significantly compared to year 2020 and that was32.2%. So, in each year the company’s total liabilities is increasing which makes their lending capability adequate.
F. Owner’s Equity
Pran-RFL Group(2019 to 2021)owner Equity( Amount in BDT):
| Particulars | 2018 | 2019 | 2020 | 2021 |
| owners’ equity | 9,637,252,251 | 10,606,685,402 | 15,715,154,000 | 16,008,986,400 |
| Increase or Decrease | 969,433,151 | 5,108,468,598 | 1,234,166,001 | |
| Increase or Decrease(Percentage) | 10% | 20% | 13% |
Interpretation:During the four years (2018-2021) of study the total growth of share-owner equity of Pran – RFL were increased. There significant changes have occurred in share-owner equity in each year. As here, 2018 is the base year share-owner equity was BDT 9,637,252,251.The changes in share-owner equity have been increased 10% from 2018 to 2019. In 2020 the highest increased share-owner equity 20% that was BDT 15,715,154,000 compare to 2019.But in 2021, the changes in share-owner equity decline 13% compare to 2020.Al though, in each year company’s total owners’ equity is increasing which makes their value of share holders’ is adequate.
4.2.Common Size Income Statements
The common-size income statements of Pran-RFL are given below:
| Years | 2018 | 2019 | 2020 | 2021 |
| Revenue | 100% | 100% | 100% | 100% |
| (-) Cost of sales | -61.91% | -48.90% | -59.31% | -57.38% |
| Gross profit | 38.09% | 51.1% | 40.69% | 42.62% |
| (+) Other income | 2.39% | 3.67% | 4.51% | 5.21% |
| (-) Administrative expenses | -29.89% | -43.21% | -35.41% | -31.19% |
| Operating profit | 10.59% | 13.56% | 9.79% | 16.64% |
| Gain from sales and brands | 0.00% | 0.00% | 17.29% | 9.45% |
| (Investment impairment provision) | -0.00% | -1.00% | -1.21% | -1.25% |
| (-) Net finance costs | -2.76% | -2.40% | -2.63% | -1.70% |
| Profit before contribution to WPPF | 8.83% | 10.16% | 23.24% | 23.14% |
| (-) Contribution to WPPF | -0.83% | -0.16% | -0.51% | -1.96% |
| Profit before tax | 8.00% | 10.00% | 22.73% | 21.18% |
| (-) Income tax expense | -1.50% | -2.60% | -3.90.% | -4.12% |
| Net Profit | 6.50% | 7.4% | 18.83% | 17.06% |
Interpretation:The table shows that the common size income statement of Pran-RFL Group,during the research period cost of goods sold has varied from 61.91% to 48.90% (2018 to 2019) and from 59.31% to 57.38% (2020-2021) of gross revenue . Operating profit has recorded variation from 10.59% to 16.64% in 2018-2021. There have some reasons to increase of operating profit those are increasing of revenue, other income and decreasing of cost of sales than the previous year. The table reveals the sudden fall in net finance costs in the year 2018-2021. The Net profit of the company has shown the good position throughout the study period.
The Net profit of the company has shown the good position throughout the study period. It was slightly fluctuating from 18.83% in 2020 to 17.06% in 2021.The overall picture reveals varied profitability of the company studied in the research period.
4.3.Financial Ratio Analysis:
The ratios are given below with explanation:
A. Liquidity Ratio
The two basic measures of liquidity are:
1.Current ratio
2.Quick (acid-test) ratio
3.Net working capital
- Current Ratio:The calculations of Current Ratio of Pran-RFL Group are given bellow:
| Particulars | 2021 | 2020 | 2019 | 2018 |
| Current Assets | 16,842,321,762 | 14,843,969,693 | 13,871,936,329 | 13,680,921,641 |
| Current Liabilities | 9,213,699,588 | 9,693,808,647 | 11,543,789,001 | 12,035,987,126 |
| Ratio | 1.827 | 1.531 | 1.25 | 1.132 |
Interpretation:During the four years (2018-2021) of study the Current Ratio of Pran – RFL were increased. Current Ratio of Pran- RFL Group, it appears that in any of the years the Current Ratio did not meet the standard which is 2:1. Pran-RFL Group current ratio was 1.132 in 2018 and last year 2021 current ratio was 1.827.In 2019 and 2020 current ratio was 1.25 and 1.531.Where In 2021 the ratio was slightly was slightly increasing than the previous years. And it can be seen that year by year it was increased and it’s near to the standard of current ratio.Its good sing for Pran-RFL group. 31
2.Quick (Acid-Test) Ratio:The quick ratio is calculated as follows:
Pran- RFL Group 2018-2021Quick Ratio(Acid Test):
| Particulars | 2018 | 2019 | 2020 | 2021 |
| Current Assets | 13,680,921,641 | 13,871,936,329 | 14,843,969,693 | 16,842,321,762 |
| Inventories | 3,765,490,934 | 3,652,432,162 | 4,011,328,721 | 5,899,181,241 |
| Current Liabilities | 12,035,987,126 | 11,543,789,001 | 9,693,808,647 | 9,213,699,588 |
| Quick Ratio | 0.8238 | 0.885 | 1.117 | 1.187 |
Interpretation:During the four years (2018-2021) of study the the quick ratio of Pran – RFL were increased.The ideal quick ratio is 1:1.It can be seen that the quick ratio of Pran-RFL Group was 0.823 in 2018 and last year 2021 it was increased 1.187 and these was standard position of Quick Ratio. In 2019 to 2020 the ratio was respectively 0.885 and 1.117. There had been an increasing trend in current assets, current liabilities and inventory.Its good for the company.
32
3. Net Working capital Ratio: Net working capital ratio of Pran -RFL Group. is calculated as follows:
Pran -RFL Group 2018-2021 Net Working Capital (Amount in BDT):
| Particulars | 2018 | 2019 | 2020 | 2021 |
| Net Working capital | 1,644,934,515 | 2,328,147,328 | 5,150,161,046 | 7,628,622,174 |
| Net Assets | 13,680,921,641 | 13,871,936,329 | 14,843,969,693 | 16,842,321,762 |
| Net Working capital Ratio | 0.120 | 0.167 | 0.346 | 0.452 |
Interpretation:During the four years (2018-2021) of study the net working capital Ratio of Pran – RFL were increased.It can be seen that the net working capital ratio of Pran -RFL Group in 2018 was 0.12 and the last year 2021 it was 0.452 and it increased than the previous years that was 0.346 in 2020 And it was a significant changed for Pran -RFL Group.Because the previous two years the percentage of the ratio was so low.Al though an optimal net working capital ratio is 1 .
- Activity Ratios
Inventory Turnover Ratio:The calculations of Inventory Turnover Ratio are given bellow:
Pran -RFL Group 2018-2021Activity Ratio( Amount in BDT):
| Particulars | 2018 | 2019 | 2020 | 2021 |
| Cost of Goods Sold | 9,502,875,643 | 7,845,674,020 | 10,689,087,341 | 11,155,820,768 |
| Average Inventories | 2,786,767,051 | 2,399,288,691 | 3,415,043,879 | 3,900,636,632 |
| Inventory Turnover Ratio | 3.41 | 3.27 | 3.13 | 2.86 |
Interpretation:During the four years (2018-2021) of study the inventory turnover ratio of Pran – RFL were decreased. Inventory turnover ratio of Pran -RFL Group, it appears that in any of the years Inventory Turnover Ratio did not meet the standard which is 4:1. The average position of Inventory Turnover Ratio in 2018 was 3.41(107.03 days) and that was near to the standard. But year by year it was decreasing in 2019, 2020 and 2021 ratio was 3.37(108.30 days),3.13(116.61 days) and 2.86(127.61 days).This happened because they had more inventories piled up than the sales proceeds which indicate the company over spent by buying too much inventory.
- Total Asset Turnover Ratios:The calculations of Pran -RFL Group 2018-2021 Total Asset Turnover Ratios are given below::
Pran -RFL Group2018-2021 Total Asset Turnover Ratio( Amount in BDT):
| Particulars | 2018 | 2019 | 2020 | 2021 |
| Sales | 15,349,500,312 | 16,044,323,150 | 18,022,403,205 | 19,442,002,035 |
| Total Assets | 18,315,098,199 | 19,395,912,591 | 23,837,913,397 | 27,971,437,641 |
| Total Assets Turnover Ratio | 0.838 | 0.827 | 0.756 | 0.695 |
Interpretation:During the four years (2018-2021) of study the total asset turnover ratio of Pran – RFL were decreased.Here in 2018 the ratio was 0.838.In 2019 the ratio was decreased to 0.837 and in 2020 and 2021 it was again decreased respectively to 0.756 and 0.695.It can be said that the Total Assets Turnover Ratio deceasing day by day so is not good of Pran -RFL Group.
C. Debt Ratios
Debt Ratio:The ratio is calculated as follows:
Pran -RFL Group2018-2021 Debt Ratio (Amount in BDT):
| Particulars | 2018 | 2019 | 2020 | 2021 |
| Total Liabilities | 13,035,724,749 | 12,932,637,973 | 11,983,746,103 | 14,321,932,821 |
| Total Assets | 18,315,098,199 | 19,395,912,591 | 23,837,913,397 | 27,971,437,641 |
| Debt Ratio | 71.17% | 66.67% | 50.27% | 51.20% |
Interpretation:Like every other company Pran -RFL Group Debt Ratio includes both long-term and short-term debt. It also contains the company’s tangible assets and intangible assets. Property & plants, inventories etc. are tangible assets and software, trademarks etc. are the intangible assets of Pran -RFL Group. Since Pran -RFL Group debt ratio was 71.17% in 2018 which was higher than any other year it can be said that they took higher financial risk. From 2019 to 2020 the ratios were decreasing respectively 66.67%, to50.27% which has a decreasing trend due to irregularity in debt value. The debt ratio was increased in 2021 the ratio was 51.2%.
Profitability Ratios
- Gross Profit Margin:The gross profit margin of Pran -RFL Group is calculated as follows:
Pran -RFL Group 2018-2021Gross Profit Margin( Amount in BDT):
| Particulars | 2018 | 2019 | 2020 | 2021 |
| Gross Profits | 5,846,624,669 | 8,198,649,130 | 7,333,315,864 | 8,286,181,267 |
| Sales | 15,349,500,312 | 16,044,323,150 | 18,022,403,205 | 19,442,002,035 |
| Gross Profit Margin | 38.09% | 51.1% | 40.69% | 42.62% |
Interpretation:During the four years (2018-2021) of study the gross profit margin ratio of Pran – RFL were fluctuated.The Gross profit margin Pran -RFL Group was 38.09% in 2018.In 2019 it higher than others and it was 51.10%.But 2021 gross profit margin higher than 2020 and it was 40.69% to 42.62% . It rose in 2021 compare to 2018 may be they minimize their expenses and generated more revenues. It refers good condition of the company.
- Operating Profit Margin:The operating profit margin is calculated as follows:
Pran -RFL Group2018-2021Operating Profit Margin( Amount in BDT):
| Particulars | 2018 | 2019 | 2020 | 2021 |
| Operating Profits | 1,625,512,083 | 2,175,610,219 | 1,764,393,274 | 3,235,149,139 |
| Sales | 15,349,500,312 | 16,044,323,150 | 18,022,403,205 | 19,442,002,035 |
| Operating Profit Margin | 10.59% | 13.56% | 9.79% | 16.64% |
Interpretation:During the four years (2018-2021) of study the Operating profit margin ratio of Pran – RFL were fluctuated.It can be seen that from 2018 to 2021 the Operating profit margin has fluctuated due to cost variation in different years. In 2018 it was 10.59% .In 2019 it was increased and the ratio was 13.56% . In 2020 it was slightly decreased compare to previous two years. And in 2021 it was highly increased and that was 16.64%. This 16.64% means that for every TK.1 of income, only 16.64 Paisa remains after the operating expenses have been paid. So 2021 performance was good than others year.
- Return on Total Assets (ROA):The return on total assets of Pran -RFL Group is calculated as follows:
Pran -RFL Group (2018-2021)Return on Total Assets( Amount in BDT):
| Particulars | 2018 | 2019 | 2020 | 2021 |
| Earnings available for Common Stock holders | 1,137,367,598 | 1,741,752,951 | 3,535,162,557 | 3,507,618,280 |
| Total Assets | 18,315,098,199 | 19,395,912,591 | 23,837,913,397 | 27,971,437,641 |
| Return on Total Assets | 6.21% | 8.98% | 14.83% | 12.54% |
Interpretation:During the four years (2018-2021) of study the ROA ratio of Pran – RFL were fluctuated.Here in table it can be seen that in, 2018, 2019 &2020 the ROA ratio was respectively 6.21 %, 8.98 %, & 14.83%. In 2021 it decreased slightly to 12.54% due to lower earnings compare to the previous year. Here 12.54% means Pran -RFL Group generates 12.54% TK by using TK 1 assets.But considering a growing organization this percentage of return is acceptable.However 2020 performance is good than others year.
E.Return on Common Equity (ROE):The return on common equity of Pran -RFL Group is calculated as follows:
Pran -RFL Group 2018-2021 Return on Common Equity( Amount in BDT):
| Particulars | 2018 | 2019 | 2020 | 2021 |
| Earnings available for Common Stock holders | 1,137,367,598 | 1,741,752,951 | 3,535,162,557 | 3,507,618,280 |
| Common Stock Equity | 11,249,926,785 | 14,648,889,411 | 15,945,703,911 | 18,549,012,586 |
| Return on Common Stock (ROE) | 10.11% | 11.89% | 22.17% | 18.91% |
Interpretation:During the four years (2018-2021) of study the ROE ratio of Pran – RFL fluctuated.Here the ratio was 10.11% in 2018. This means that every Tk.1 of common shareholder’s equity earned about 10.11 Paisa this year. In other words, shareholders saw a 10.11 percent return on their investment. From 2019 and 2020 it was increased respectively 11.89%, 22.17% . In 2021 it shows that, the ratio was slightly decreased by 18.91%. But considering a growing organization this percentage of return is acceptable.However 2020 performance is good than others year.
4.4.Findings
The key functions which affect a company’s liquidity and profitability are total assets, total liabilities, owner’s equity, current ratio, quick ratio, debt to equity ratio, ROA and inventory turnover ratio. However, other ratios are also important since they also measure company’s performance. Based on the financial performance analysis, both positive and negative findings can be observed. Overall finding that we observed from above ratio analysis of Pran – RFL Group are stated below:
1. Horizontal Analysis:
- Revenue: There is an increasing trend in the changes of revenue. However in 2021, the changes in revenue decreased by 7.85% compared to 2020.So, in each year company’s total revenue is increasing which leads to sale are adequate.
- Operating Profit: Total growths of operating profit of Pran – RFL Group were decreased 14%(BDT 143,671,805) in 2021 than the year of 2020 and 2019. That’s not a good sign for this company.
- Profit after tax: The profit after tax of Pran – RFL Group was decreased (BDT 36,171,589) in 2021 than year 2020.But,the company’s overall Profit After Tax is growing than previous year , So,the condition of profit after tax of this company is quite good.
- Total Assets: The total growths of total assets of Pran – RFL Group2021 were increased 22.36%(BDT4,133,524,244) than previous years.So,the condition of total assets of this company is quite good.
- Total Liabilities: This company’s total liabilities in2020 to 2021 total liabilities was increased 32.2%(BDT3,338,186,718)which makes their lending capability is sufficient.So,the condition of total liabilities of this company is good.
- Owner Equity:This company’s owner’s equity in 2020 to 2021 were increased 13%(BDT1,234,166,001) .There significant changes have occurred in owner’s equity in each year that was increasing trend which makes their value of shareholders’ are sufficient.So,the condition of owners equity of this company is good.
2. Common-size income statement:
In this analysis every proportion of the items on the income statement was rising.During the research period cost of goods sold has varied from 61.91% to 48.90% (2018 to 2019) and from 59.31% to 57.38% (2020-2021).In 2021 the gross profit, operating profit was increased than the previous years.From 2018 to 2021, operating profit varied from 10.59% to 16.64%. In the same way, profit before tax and the net profit also increased compared to previous years. So the financial position of Pran – RFL Group is sound good.
3 .Financial Ratio Analysis:
- Liquidity Ratio: Pran – RFL group Current Ratio failed to achieve standard which is 2:1. But the Current Ratio of Pran – RFL Group 1.827 in 2021. Even every year the ratio is increasing .So the current ratio of Pran-RFL group is good.
- Quick Ratio :Pran – RFL group Quick Ratio meets the standards (1:1).The Quick Ratio of Pran – RFL Group 1.187 in 2021 . So Company is able to cover current liabilities by current assets.
- Net Working capital ratio:Pran – RFL group Net Working capital well (0.452) in 2021 than the previous years.The liquidity ratio of Pran – RFL Group is quite good.
- Activity Ratios:Any of the years Inventory Turnover Ratio did not meet the standard which is 4:1. In 2021 it was 2.86. So Inventory Turnover Ratio of the company is not good.
- Debt Ratio:The Debt Ratio was increased in 2021 and the ratio was 51.2%. The Debt Ratio is close to the standard ratio 50%.
- Profitability Ratios:
- Gross profit margin: There is an increasing trend (from40.69% to 42.62% in year 2020 to 2021) of Gross profit margin at Pran – RFL Group. so it is quite good.
- Operating Profits:There is an increasing trend(from16.64% to 9.79% in year 2020 to 2021) of Operating Profits at Pran – RFL Group. So it is quite good.
- Return on Total Assets shows increasing trends year 2018 to 2020, which is desirable. But in the last year 2021 ROA 12.54% decreased than previous year.
- Return on Common Equity shows increasing treads year 2018 to 2020. But in the last year 2021 ROE 18.91% decreased than previous year.
Read More:
Chapter 5
Recommendations
5.1. Recommendations
As we all know that Pran – RFL Group is one of the well-known organizations in our country. From my little knowledge, it is quite hard to give recommendations to such a well-established organization. Still from my learning and observation, I am giving following recommendation to follow:
- Pran – RFL Group should keep liquid assets or safety cash balance for unanticipated crisis.They can invest in short term marketable securities which generate more revenue for the firm.
- As the Pran – RFL Group is maintaining a healthy financial condition they should invest more in new business with its working capital to obtain more financial liquidity in the future.
- Pran-RFL Group can reduce cost, increase demand for inventory, turn to automation, optimize supply chain, forecasting technique fixed to sound inventory turnover ratio.
- As the Pran – RFL Group has several products in this segment they can develop strategy to build up new competencies and requires the business to develop modified products which can appeal to existing markets.
- Pran – RFL Group have to manage their assets carefully so that they can achieve maximum benefit from the investment and increase the return on asset ratio by increasing net income.
- Company can increase cash flow, avoid financing fixed assets, utilize trade credit insurance, reduce bad debt to increase working capital
5.2. Conclusion
PRAN-RFL Group is one of the largest conglomerates in Bangladesh. It is the largest agribusiness & plastic product manufacturer in Bangladesh. Pran RFL group consists of two groups. One is Pran group, another is RFL group. Rangpur Foundry Ltd (RFL) was founded by Major General Amjad Khan Chowdhury(Retd) in 1981.This group initially started its journey with cast iron (CI) products in 1981. The initial main objective was to ensure pure water and affordable irrigation instruments for improving rural life.
To know the financial positions and its share conditions the financial performance analysis is necessary. All analysis helps to find out the strength of Pran – RFL Group. Pran – RFL Group have immense opportunity to expand its business in future and contribute more in the economy of Bangladesh.
Achievement of Pran – RFL Group is beyond description. Maintaining Government rules and regulations Pran – RFL Group always try to contribute on national G.D.P. and G.N.P. not only local business but also internationally. Pran – RFL Group follows most of the compensations practices and policy. They always try to contribute to employee satisfaction and given to employee all types of compensation benefits.
Reference:
*Annual Report of Pran- RFL Group(2018 to 2021)
*Various others financial Report
*Reference Desk, J. N. (2022, January 7). Pran-RFL to invest Tk 1700cr in consumer products, poultry businesses.
*Retrievedfromjagonews24.com: https://www.jagonews24.com/en/business/news/59735# RFL. (n.d.). (n.d.). rflbd. Retrieved from https://www.rflbd.com
Do you find this Blog informative or helpful? Let us know in the comment section below. Stay Healthy.
please let me know in the comment section below, please.
Share and stay healthy.
Thank you!
Read More:
PDF Book: Click Here
If you need more informative posts like this, you can follow me on Facebook page and YouTube channel. Below is the link.
Thank you……….!